Step-by-Step PDAL Python Workflow for LiDAR Data Processing
- Anvita Shrivastava

- 11 hours ago
- 4 min read
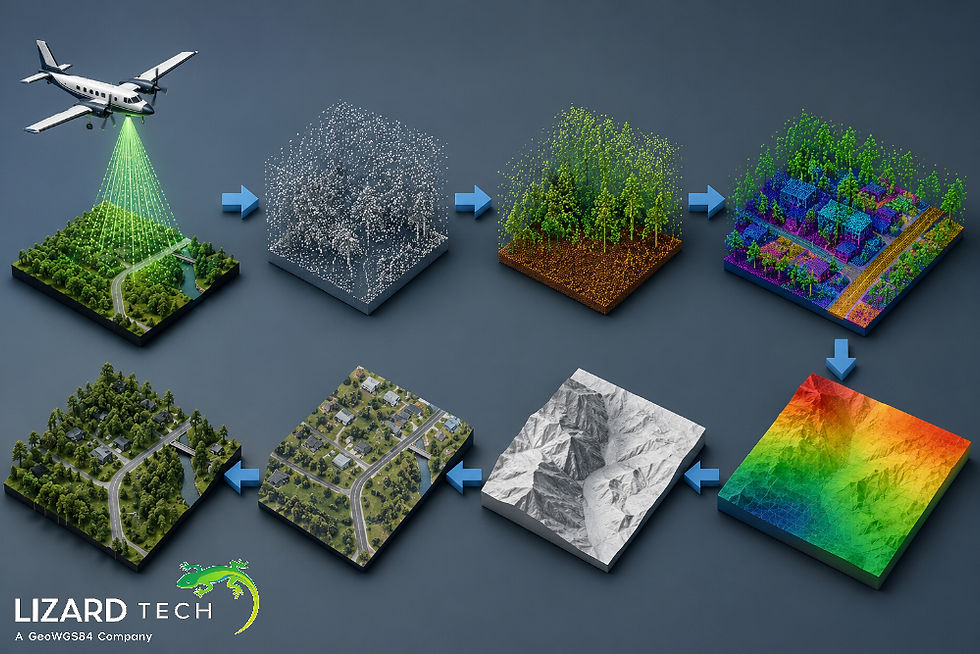
Light Detection and Ranging (LiDAR) is now a dominant and critical technology in the fields of geospatial analysis, modeling, and data collection for planning and building cities, forestry, and infrastructure development. With the ever-increasing volumes and complexity of LiDAR datasets, the need for well-organized and streamlined workflows to access and process meaningful information from these types of data is becoming more important than ever.
Point Data Abstraction Library (PDAL) is an open-source library for manipulating point cloud data, and when coupled with the Python programming language, allows developers, GIS professionals, and Data Scientists to automate tasks associated with LiDAR processing; to create scalable workflows for LiDAR processing; and to build point cloud analysis into larger and more detailed geospatial applications.
In this document, we present a step-by-step workflow for LiDAR data processing using PDAL and Python. We will cover how to download and install PDAL; how to view and check the contents of a LiDAR dataset; how to filter a LiDAR dataset; how to assign classes to all of the points in your LiDAR dataset; and finally, how to export your filtered and classified LiDAR dataset into various formats.
What Is PDAL?
PDAL is an open-source toolset used to manipulate, translate, filter, and analyze point cloud data. It accommodates multiple data formats:
LAS
LAZ
E57
GeoTIFF
BPF
PLY
PDAL features a pipeline architecture allowing users to define their own sequence of operations when working with LiDAR data.
Benefits of Using PDAL
Active Development/Support.
Capable of handling very large LiDAR datasets.
Can be integrated via Python.
Has a comprehensive range of filters and classifiers.
Fully compatible with GIS and Remote Sensing workflows.
Prerequisites
Before starting, ensure the following are installed:
Install PDAL
Using Conda:
conda install -c conda-forge pdal python-pdalVerify installation:
python -c "import pdal; print(pdal.__version__)"Required Python Libraries
pip install numpy pandas matplotlibStep 1: Load a LiDAR Dataset
The first step is reading a LAS or LAZ file using PDAL.
import pdal
import json

pipeline_json = {
    "pipeline": [
        "sample.las"
    ]
}

pipeline = pdal.Pipeline(json.dumps(pipeline_json))
pipeline.execute()

arrays = pipeline.arrays
point_cloud = arrays[0]

print(point_cloud.dtype)
print(len(point_cloud))
What This Does
Loads the LiDAR file
Executes the pipeline
Stores point cloud data in a NumPy array.
Displays available dimensions and point count
Step 2: Inspect Point Cloud Attributes
LiDAR datasets contain multiple attributes such as:
X, Y, Z coordinates
Intensity
Return number
Classification
Scan angle
View available fields:
print(point_cloud.dtype.names)Example output:
('X', 'Y', 'Z', 'Intensity', 'Classification')Understanding these attributes helps determine the appropriate processing strategy.
Step 3: Create a Basic PDAL Pipeline
PDAL workflows are typically built using JSON pipelines.
Example:
pipeline_json = {
    "pipeline": [
        {
            "type": "readers.las",
            "filename": "sample.las"
        }
    ]
}
This simple pipeline reads a LAS file into memory.
Step 4: Filter LiDAR Data by Elevation
Filtering allows you to isolate specific points based on conditions.
Example: Keep points above 100 meters.
pipeline_json = {
    "pipeline": [
        "sample.las",
        {
            "type": "filters.range",
            "limits": "Z[100:]"
        }
    ]
}
Execute:
pipeline = pdal.Pipeline(json.dumps(pipeline_json))
pipeline.execute()
filtered_points = pipeline.arrays[0]
Use Cases
Terrain analysis
Building extraction
Vegetation studies
Step 5: Remove Noise from Point Clouds
LiDAR datasets often contain outlier points caused by sensor errors or atmospheric interference.
PDAL provides statistical outlier filtering:
pipeline_json = {
    "pipeline": [
        "sample.las",
        {
            "type": "filters.outlier",
            "method": "statistical",
            "mean_k": 8,
            "multiplier": 2.0
        }
    ]
}
Benefits include:
Improved surface models
Cleaner visualizations
More accurate classifications
Step 6: Ground Classification
Ground classification separates terrain points from vegetation and structures.
pipeline_json = {
    "pipeline": [
        "sample.las",
        {
            "type": "filters.smrf",
            "scalar": 1.2,
            "slope": 0.2,
            "threshold": 0.45,
            "window": 16.0
        }
    ]
}
Why Ground Classification Matters
Ground points are essential for:
Flood modeling
Slope analysis
Contour generation
Step 7: Generate a Digital Terrain Model (DTM)
After identifying ground points, create a rasterized terrain model.
pipeline_json = {
    "pipeline": [
        "sample.las",
        {
            "type": "filters.smrf"
        },
        {
            "type": "writers.gdal",
            "filename": "dtm.tif",
            "resolution": 1.0,
            "output_type": "min"
        }
    ]
}
Output:
dtm.tifThe generated GeoTIFF can be used in GIS software such as QGIS or ArcGIS.
Step 8: Extract Vegetation Points
Many forestry applications require identifying vegetation.
Example:
pipeline_json = {
    "pipeline": [
        "sample.las",
        {
            "type": "filters.range",
            "limits": "Classification[3:5]"
        }
    ]
}
Common vegetation classes include:
Classification | Description |
3 | Low Vegetation |
4 | Medium Vegetation |
5 | High Vegetation |
Applications:
Forest inventory
Biomass estimation
Canopy height analysis
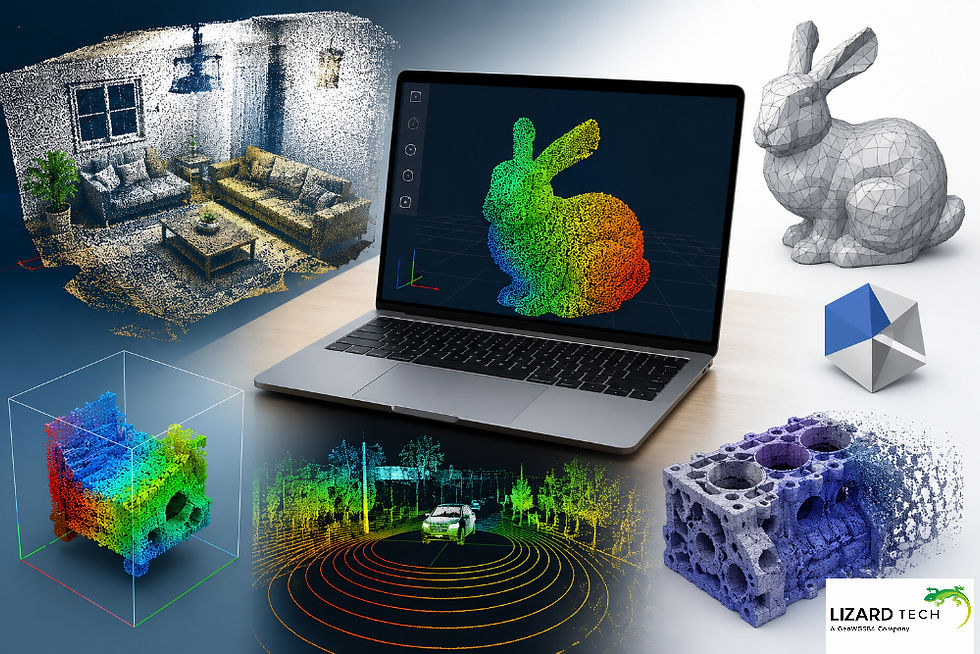
Step 9: Visualize LiDAR Data in Python
Use Matplotlib for quick visual inspection.
import matplotlib.pyplot as plt

x = point_cloud['X']
y = point_cloud['Y']

plt.figure(figsize=(8,6))
plt.scatter(x, y, s=1)
plt.title("LiDAR Point Cloud")
plt.xlabel("X")
plt.ylabel("Y")
plt.show()
Visualization helps identify:
Data coverage
Noise
Classification errors
Step 10: Export Processed LiDAR Data
Save processed point clouds to a new LAS file.
pipeline_json = {
    "pipeline": [
        "sample.las",
        {
            "type": "filters.smrf"
        },
        {
            "type": "writers.las",
            "filename": "processed.las"
        }
    ]
}
Execute:
pipeline = pdal.Pipeline(json.dumps(pipeline_json))
pipeline.execute()
Output:
processed.lasBuilding an Automated PDAL Workflow
For production environments, organize processing into reusable functions.
Example:
def process_lidar(input_file, output_file):

    pipeline_json = {
        "pipeline": [
            input_file,
            {
                "type": "filters.outlier"
            },
            {
                "type": "filters.smrf"
            },
            {
                "type": "writers.las",
                "filename": output_file
            }
        ]
    }

    pipeline = pdal.Pipeline(json.dumps(pipeline_json))
    pipeline.execute()
Benefits include:
Automation
Scalability
Reproducibility
Reduced manual effort
Best Practices for PDAL LiDAR Processing
Optimization of Large Data Sets
If possible, use LAZ file compression,
Tile Data for Processing
Make Use of Parallel Processing
Validate Coordinate System
Make Sure to Always Validate:
EPSG Codes
Vertical Datums
Projection Consistency
Maintain Metadata
Preserve:
Classification Information
Return Number
Date of Acquisition
Test Pipeline in Stages
Validate Completed Outputs at Each Stage of Processing Before Proceeding With Large-Scale Jobs.
PDAL and Python are a powerful domain-specific toolset for processing LiDAR data! With PDAL's pipeline architecture, you can load, filter, classify, view, and export point cloud data quickly and easily, allowing you to automate repetitive jobs involving geospatial data.
PDAL helps improve accuracy, reproducibility, and efficiency when building features such as Digital Terrain Models (DTM), extracting vegetation, performing analysis on infrastructure, and preparing data for machine learning.
As LiDAR datasets become larger and more complex, becoming proficient in using PDAL and Python will be a valuable skill for GIS professionals, remote sensing experts, and geospatial software developers.
For more information or any questions regarding the LizardTech suite of products, please don't hesitate to contact us at:
Email: info@geowgs84.com
USA (HQ): (720) 702–4849
(A GeoWGS84 Corp Company)


Comments