What Is Raster Data in GIS?
- Anvita Shrivastava

- Nov 17, 2025
- 4 min read
Updated: Apr 22
Raster data is one of the two main ways to represent spatial information in Geographic Information Systems (GIS). Understanding raster data is vital for GIS practitioners, remote sensing scientists, and data scientists working with geospatial datasets. In this article, we will explore the technical details of raster data, including what it is, its structure, how it can be used, its advantages, and its limitations.

What is Raster Data in GIS?
Raster data, or grid-based data, represents the world as a matrix of cells or pixels that are organized in rows and columns. Each cell is awarded a value that represents something about a certain geographic area. Raster data is unlike vector data, which represents features with points, lines, and polygons. Raster data is particularly suited for representing continuous features, such as:
Elevation
Temperature
Land Cover
Soil Moisture
Because raster data allows each geographic location to be represented with a numeric value, it is a key data structure for modeling, analyzing, and visualizing continuous spatial phenomena.
Technical Structure of Raster Data
Raster data has three main components:
Cells/Pixels: The basic unit of a raster layout. Cells store a value that signifies a feature or attribute.
Resolution: Indicates the size of each cell. If a raster has a higher resolution, cells are smaller and represent spatial information more accurately. For example, a 30m resolution raster has pixels that represent a 30m x 30m area on the surface of the land.
Extent: The geographic area that the raster covers, which is determined by the boundary coordinates.
Raster data can be single-band or multi-band:
Single-band raster: has one value per cell (e.g., elevation).
Multi-band raster: has more than one value per cell, typically used regarding a geographic area of interest or regarding satellite images (e.g., Red, Green, Blue, and Infrared bands).
Common Raster Data Formats
Depending on the use case, GIS professionals work with several raster file formats:
GeoTIFF: a georeferenced TIFF image that is quite popular in a GIS environment.
ASCII Grid: a text-based raster format that is often used for interoperability.
ERDAS Imagine (IMG): a raster format designed for high-performance raster operations for the remote sensing community.
JPEG2000: a compressed raster format that has support for multi-band imagery.
Regardless of the raster file format, all raster files can contain georeferencing information, so a raster file can be aligned with the coordinate system of the real world.
Role of MrSID in Raster Data
MrSID is a versatile raster data format that has been developed to meet the needs of large-scale image data management in the geospatial industry. There are many important features of MrSID, including:
High compression ratio and little to no degradation of quality;
Fast access to image data without the need for full decompression;
Ability to view images with different resolutions for efficient zoom-in/out; and
Optimized performance capabilities for large amounts of geospatial data.
MrSID is a very popular format used in the GIS community to manage large amounts of imagery collected from satellites, aerial photography, or LIDAR data sets, making this format a key component to successful workflows when dealing with geospatial data today.
Sources of Raster Data
Raster data may have originated from the following sources:
Satellite Imagery: Landsat, Sentinel, and MODIS
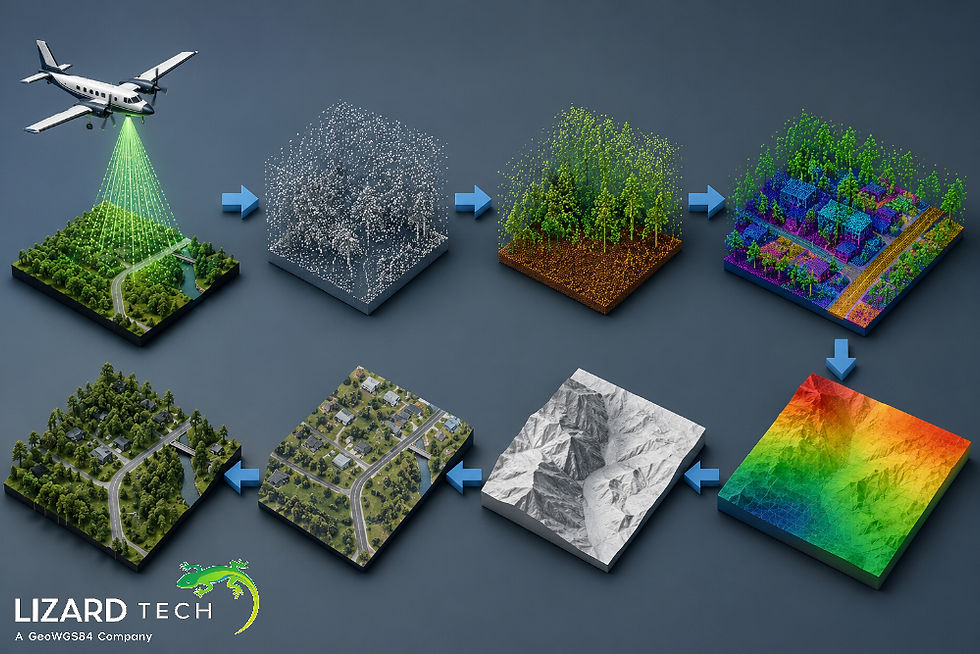
Aerial Photography: capturing images using drones and aircraft
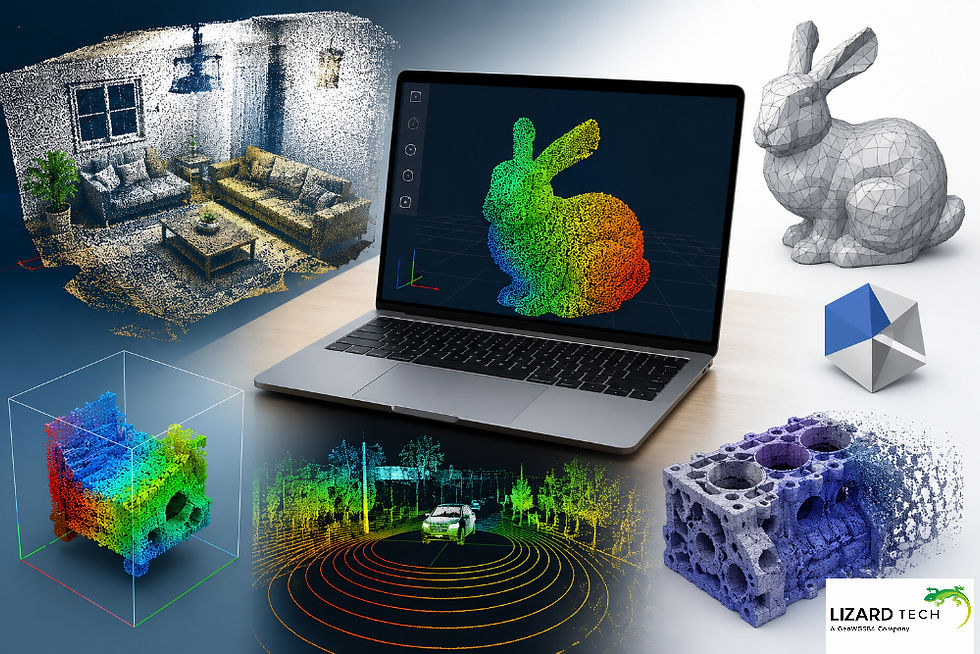
Remote sensing sensors: LiDAR and RADAR
Digital Elevation Models (DEMS): created from either topographic surveys or photogrammetry.
Uses of Raster Data in GIS
Raster data has a broad array of uses in spatial analysis and modeling, including:
Terrain Analysis: Using digital elevation models (DEMs) to determine slope, aspect, and watershed.
Environmental Monitoring: Monitoring forest health, deforestation, and pollutants.
Hydrological Modeling: Assessing flood risk, modeling the flow of water.
Urban Planning: Mapping land use and land cover, including urban heat island mapping.
Remote Sensing Analysis: Classification, calculation of NDVI, and change detection.
Strengths of Raster Data
Efficient representation of continuous data.
Facilitates the ease of processing analytical data and statistics.
It can be used for remote sensing data and satellite images.
Can simplify complex spatial analysis.
Drawbacks of Raster Data
Large storage needs for high-definition datasets
Lost accuracy compared to vector data when storing discrete objects
Inability to represent linear objects precisely
Processing-intensive with large datasets
Raster vs. Vector Data: Key Differences
Feature | Raster Data | Vector Data |
Representation | Grid of cells | Points, lines, polygons |
Best for | Continuous phenomena | Discrete features |
Storage | Large for high-resolution | Smaller for simple features |
Analysis | Pixel-based calculations | Topology-based operations |
In GIS, raster data is a fundamental resource for the study of continuous spatial phenomena. With its grid structure, compatibility with remote sensing images, and ability to work in large-scale spatial analysis, raster data serves as the backbone of geospatial intelligence. By understanding raster data, GIS professionals can conduct sophisticated spatial analysis through simulations, environmental monitoring, and the performance of predictive spatial analysis.
For more information or any questions regarding the LizardTech suite of products, please don't hesitate to contact us at:
Email: info@geowgs84.com
USA (HQ): (720) 702–4849
(A GeoWGS84 Corp Company)

Comments